Business Intelligence People Actually Trust
Reporting built on metrics defined once and agreed by everyone, refreshed automatically, and presented so the meeting starts with decisions instead of arguing about whose number is right.
Overview
What is Business Intelligence and Reporting?
Business intelligence is the practice of collecting data from the systems a business already runs, modelling it consistently, and presenting it so people can make decisions. Reporting is the delivery layer: scheduled reports and dashboards built on agreed metric definitions.
Most reporting problems are definition problems. Two teams count revenue differently, a spreadsheet has drifted, and the meeting gets spent reconciling rather than deciding. So the work starts by writing metric definitions down and agreeing them, then building the pipeline underneath: source connections, transformation, and a model that keeps history. Dashboards come last, built around the questions people actually ask, with refresh automated and failures alerting a person rather than quietly serving stale numbers.
Capabilities and features
Agree the Numbers Before Building the Charts
Every metric gets a written definition: the source, the filters, the time basis, and the owner. It is the least interesting part of the project and the reason a dashboard survives its first disagreement in a leadership meeting.
- Written definitions with source, filters, and owner per metric
- One version of revenue, churn, and pipeline across every team
- Documented somewhere people can actually find it
Refreshed on a Schedule, Not by Hand
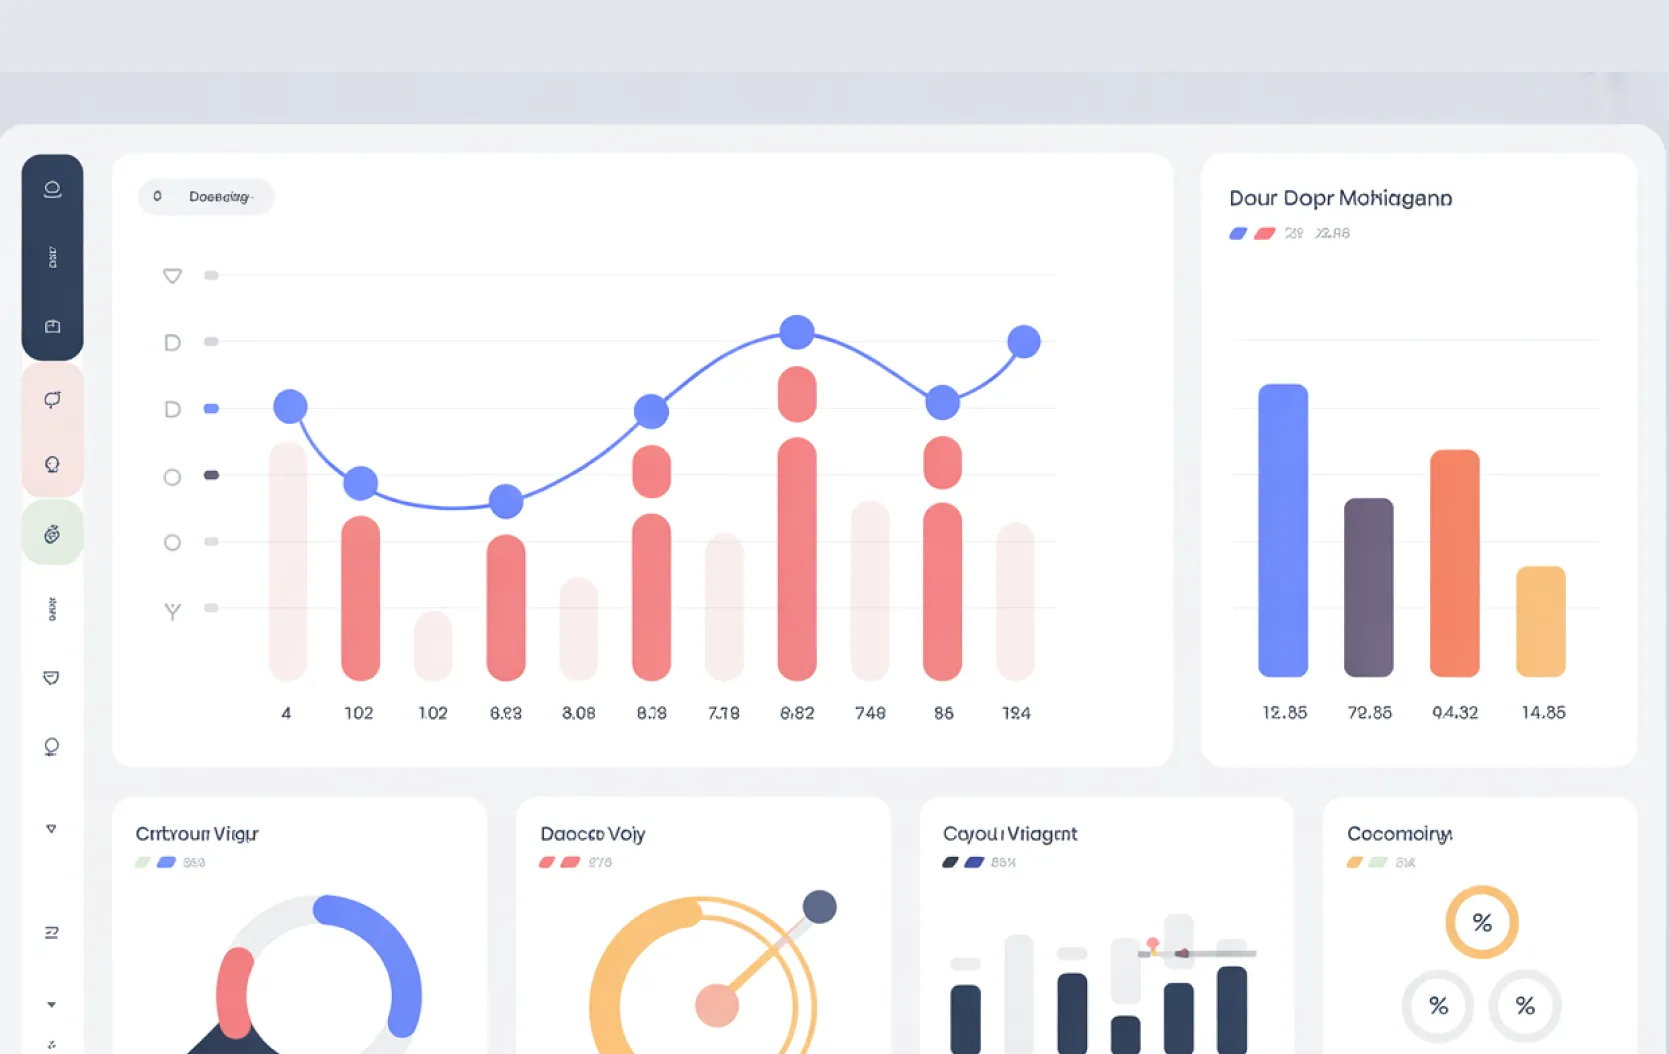
Connections to your CRM, finance system, product database, and ad platforms, with transformation and refresh automated. When a source fails or a load looks wrong, somebody is alerted rather than the dashboard quietly showing yesterday.
- Scheduled refresh with alerting on failures and anomalies
- Connections to CRM, finance, product, and marketing sources
- History preserved so trends survive a source system change
Answers Without Waiting for an Analyst
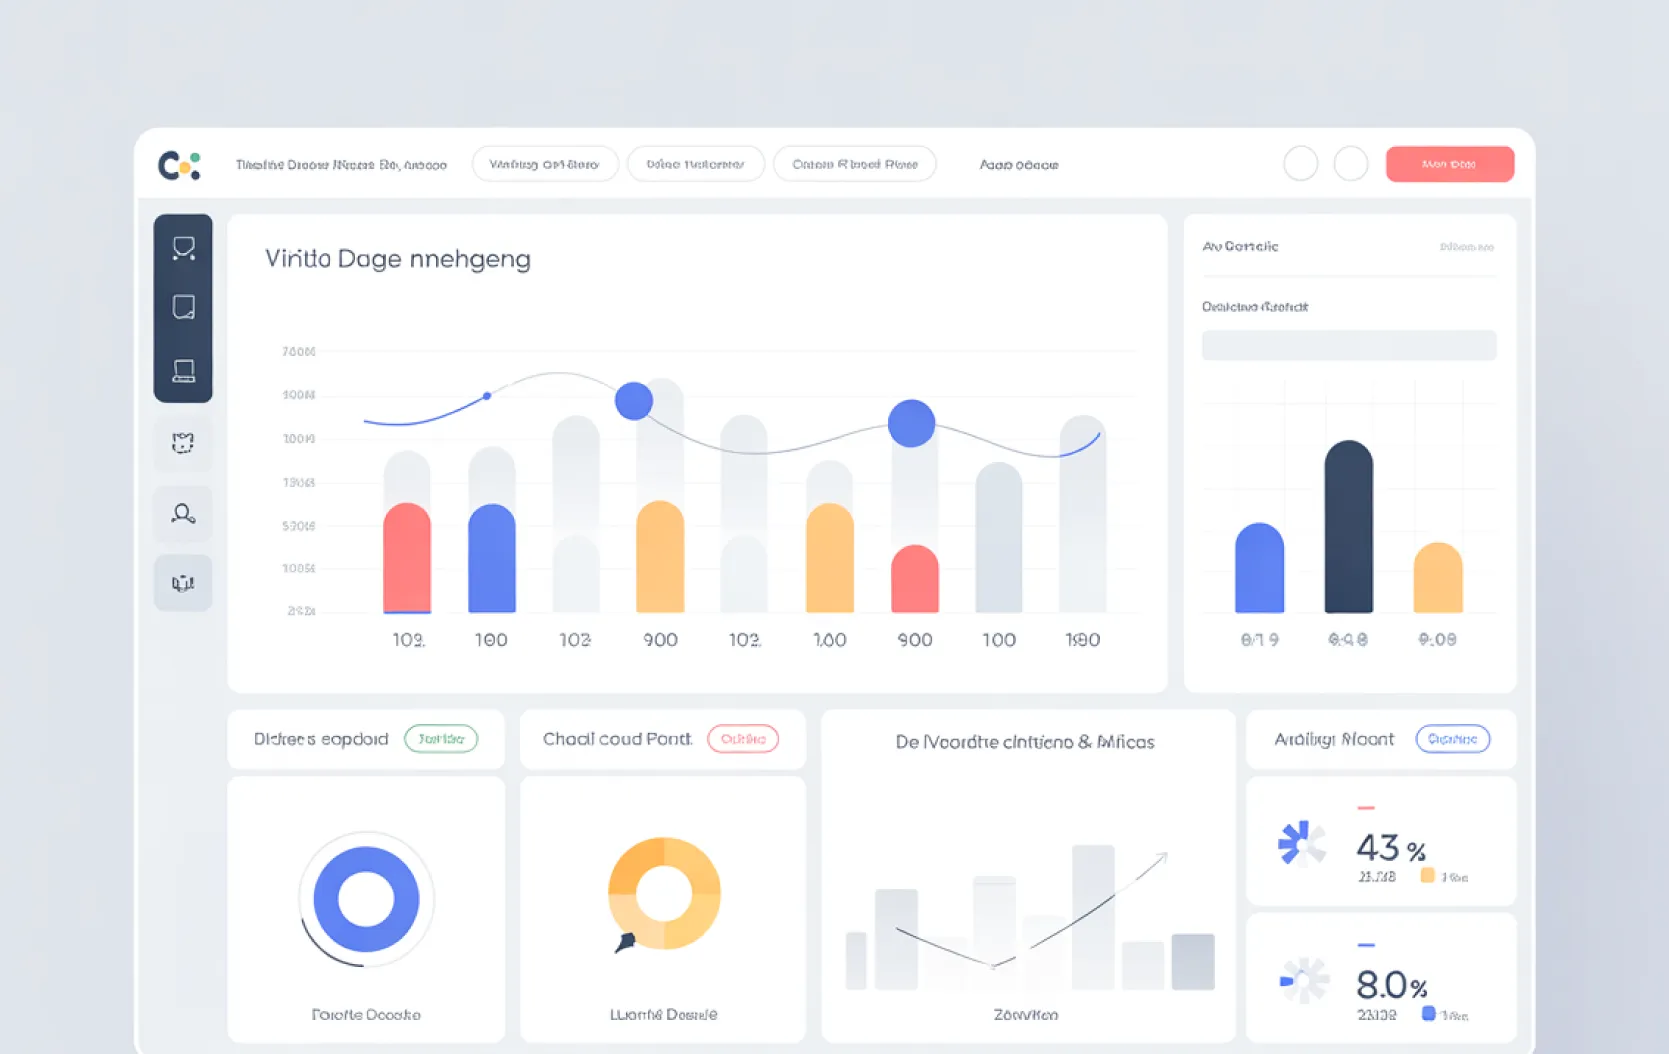
A governed model people can explore, so the obvious follow up questions do not become a request queue. Access is role based, and the metrics stay consistent no matter who builds the view or which team asks.
- Governed model in Power BI, Looker Studio, or Metabase
- Role based access so people see only their own data
- Training so your team can build views without breaking definitions
The real impact
Why it matters
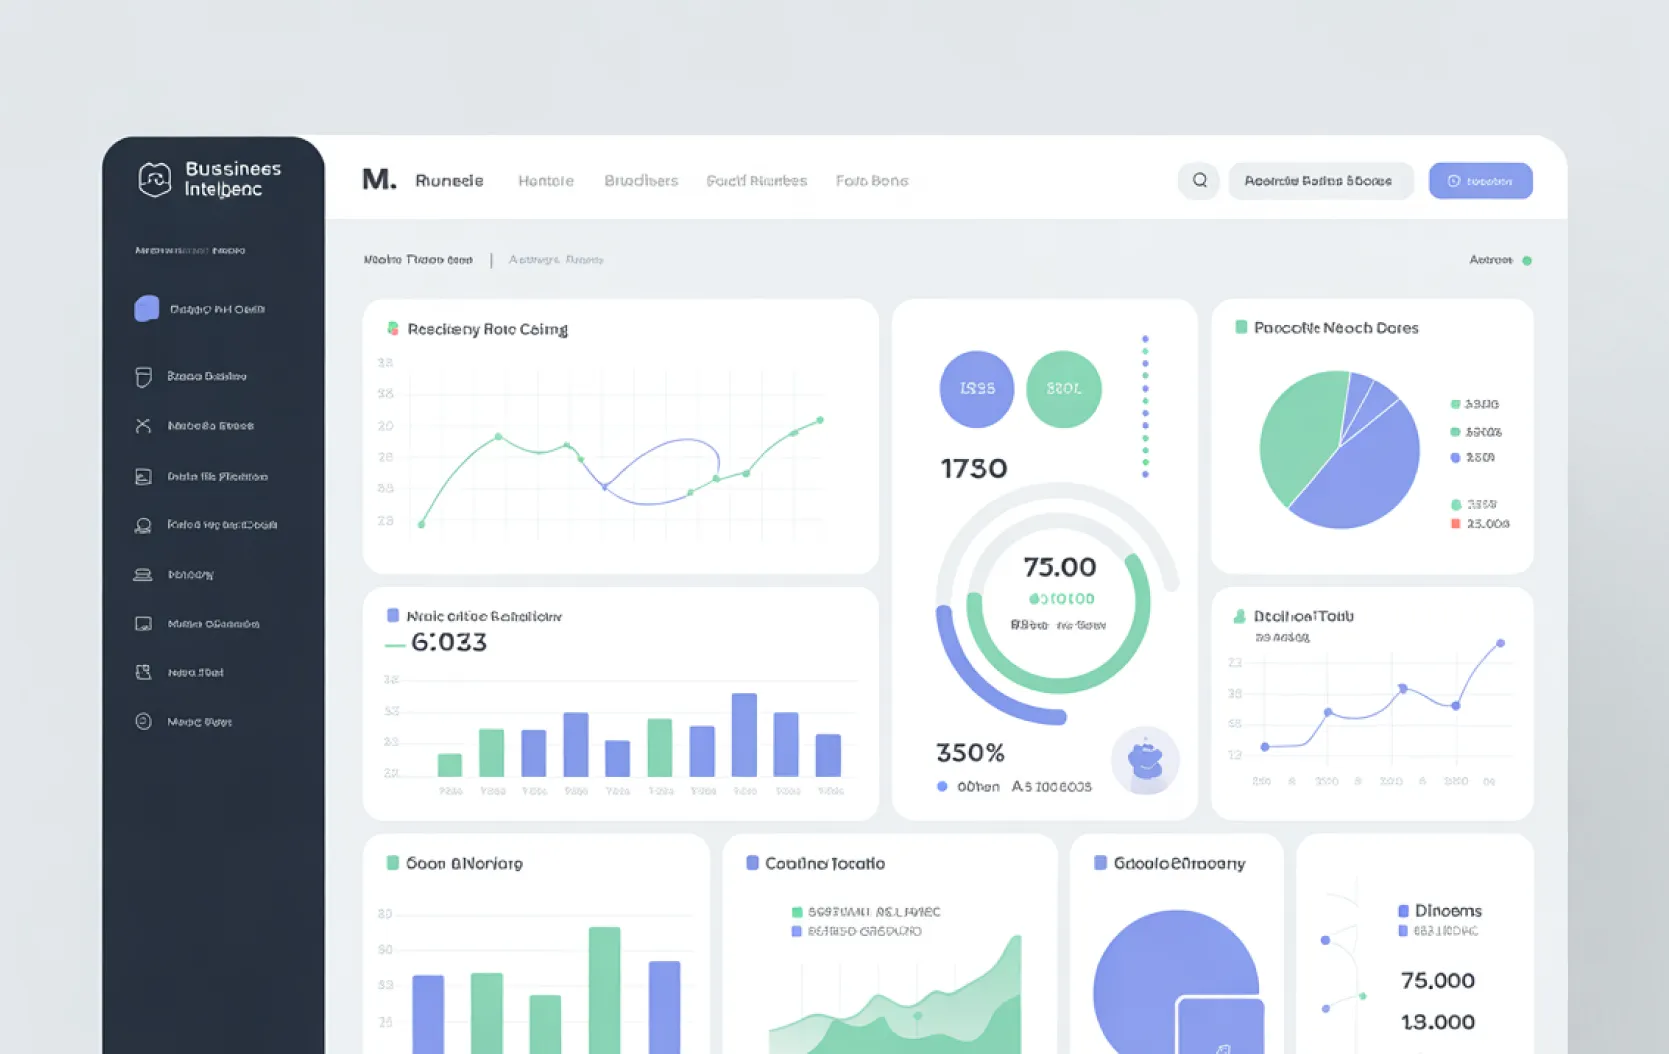
When numbers cannot be trusted, people stop using them and fall back on instinct. The cost is not the reporting tool, it is every decision made a week late or on the wrong figure, and nobody ever puts that on a line item.
The global BI market is growing at over 12% annually. Businesses that delay BI investment are not saving money. They are falling behind competitors who make faster, better-informed decisions.
Source: DataStackHub / BI Statistics, 2025
BI implementations deliver an average 127% return on investment within three years. The return comes from faster decisions, eliminated manual work, reduced errors, and better resource allocation.
Source: DataStackHub / BI Statistics, 2025
The failure rate is driven by unclear objectives, poor data quality, and scope overload. Starting with a focused pilot and expanding is far more likely to succeed than a company-wide rollout.
Source: Gartner / Integrate.io, 2026
Technologies we build with
 BigQuery
 Snowflake
 PostgreSQL
 Power BIBigQuerySnowflakePostgreSQLPower BI
 Kafka
Kafka Python
 React
React D3.jsKafkaPythonReactD3.js
Explore more
Related services
More ways we help teams with data and analytics.
FAQ
Frequently asked questions
Everything you need to know about this service.
Reporting tells you what happened, on a schedule and in a fixed format. Business intelligence is the wider practice of modelling data so people can ask their own questions and get consistent answers. Most projects deliver reporting first and self service afterwards.
Ready to start your next project?
Let us turn your idea into software that scales. Book a free consultation and we will map out the build with you.
Trusted by the teams we build with