Predictive Analytics You Can Act On
Forecasting, churn, and scoring models built on your own history, tested honestly against what actually happened, and delivered into the tools your team already uses. No black boxes.
Overview
What is Predictive Analytics?
Predictive analytics uses historical data and statistical or machine learning models to estimate what is likely to happen next, such as demand next quarter, which customers may leave, or which leads are worth calling first. Accuracy is measured against outcomes the model never saw.
A model is only useful if somebody changes a decision because of it. So the work starts from the decision rather than the algorithm: what would you do differently if you knew this a month earlier. From there the data is assessed for whether it can support the question at all, a simple baseline is set, and models are tested against held out history so accuracy is a measured number rather than a claim. Output lands in your CRM, your dashboard, or an API, with the reasoning visible so people can trust it or challenge it.
Capabilities and features
An Honest Answer on Whether Your Data Can Do This
Before any model, the data is assessed for volume, history, and quality, and a simple baseline is set. If a moving average is nearly as good as a model, you get told that, because paying for machine learning to match an average is not a result.
- Data assessment covering history, gaps, and labelling
- Simple baseline set so any improvement is measurable
- A clear no if the data cannot support the question yet
Demand and Revenue With the Error Range Shown
Forecasts for demand, revenue, or capacity, with seasonality and known events modelled explicitly and a stated confidence range instead of a single number. Performance is reported against held out periods, so you know how wrong it tends to be.
- Seasonality, trend, and known events modelled explicitly
- Confidence ranges reported, not just one figure
- Accuracy measured on periods the model never saw
Which Customers, and Why
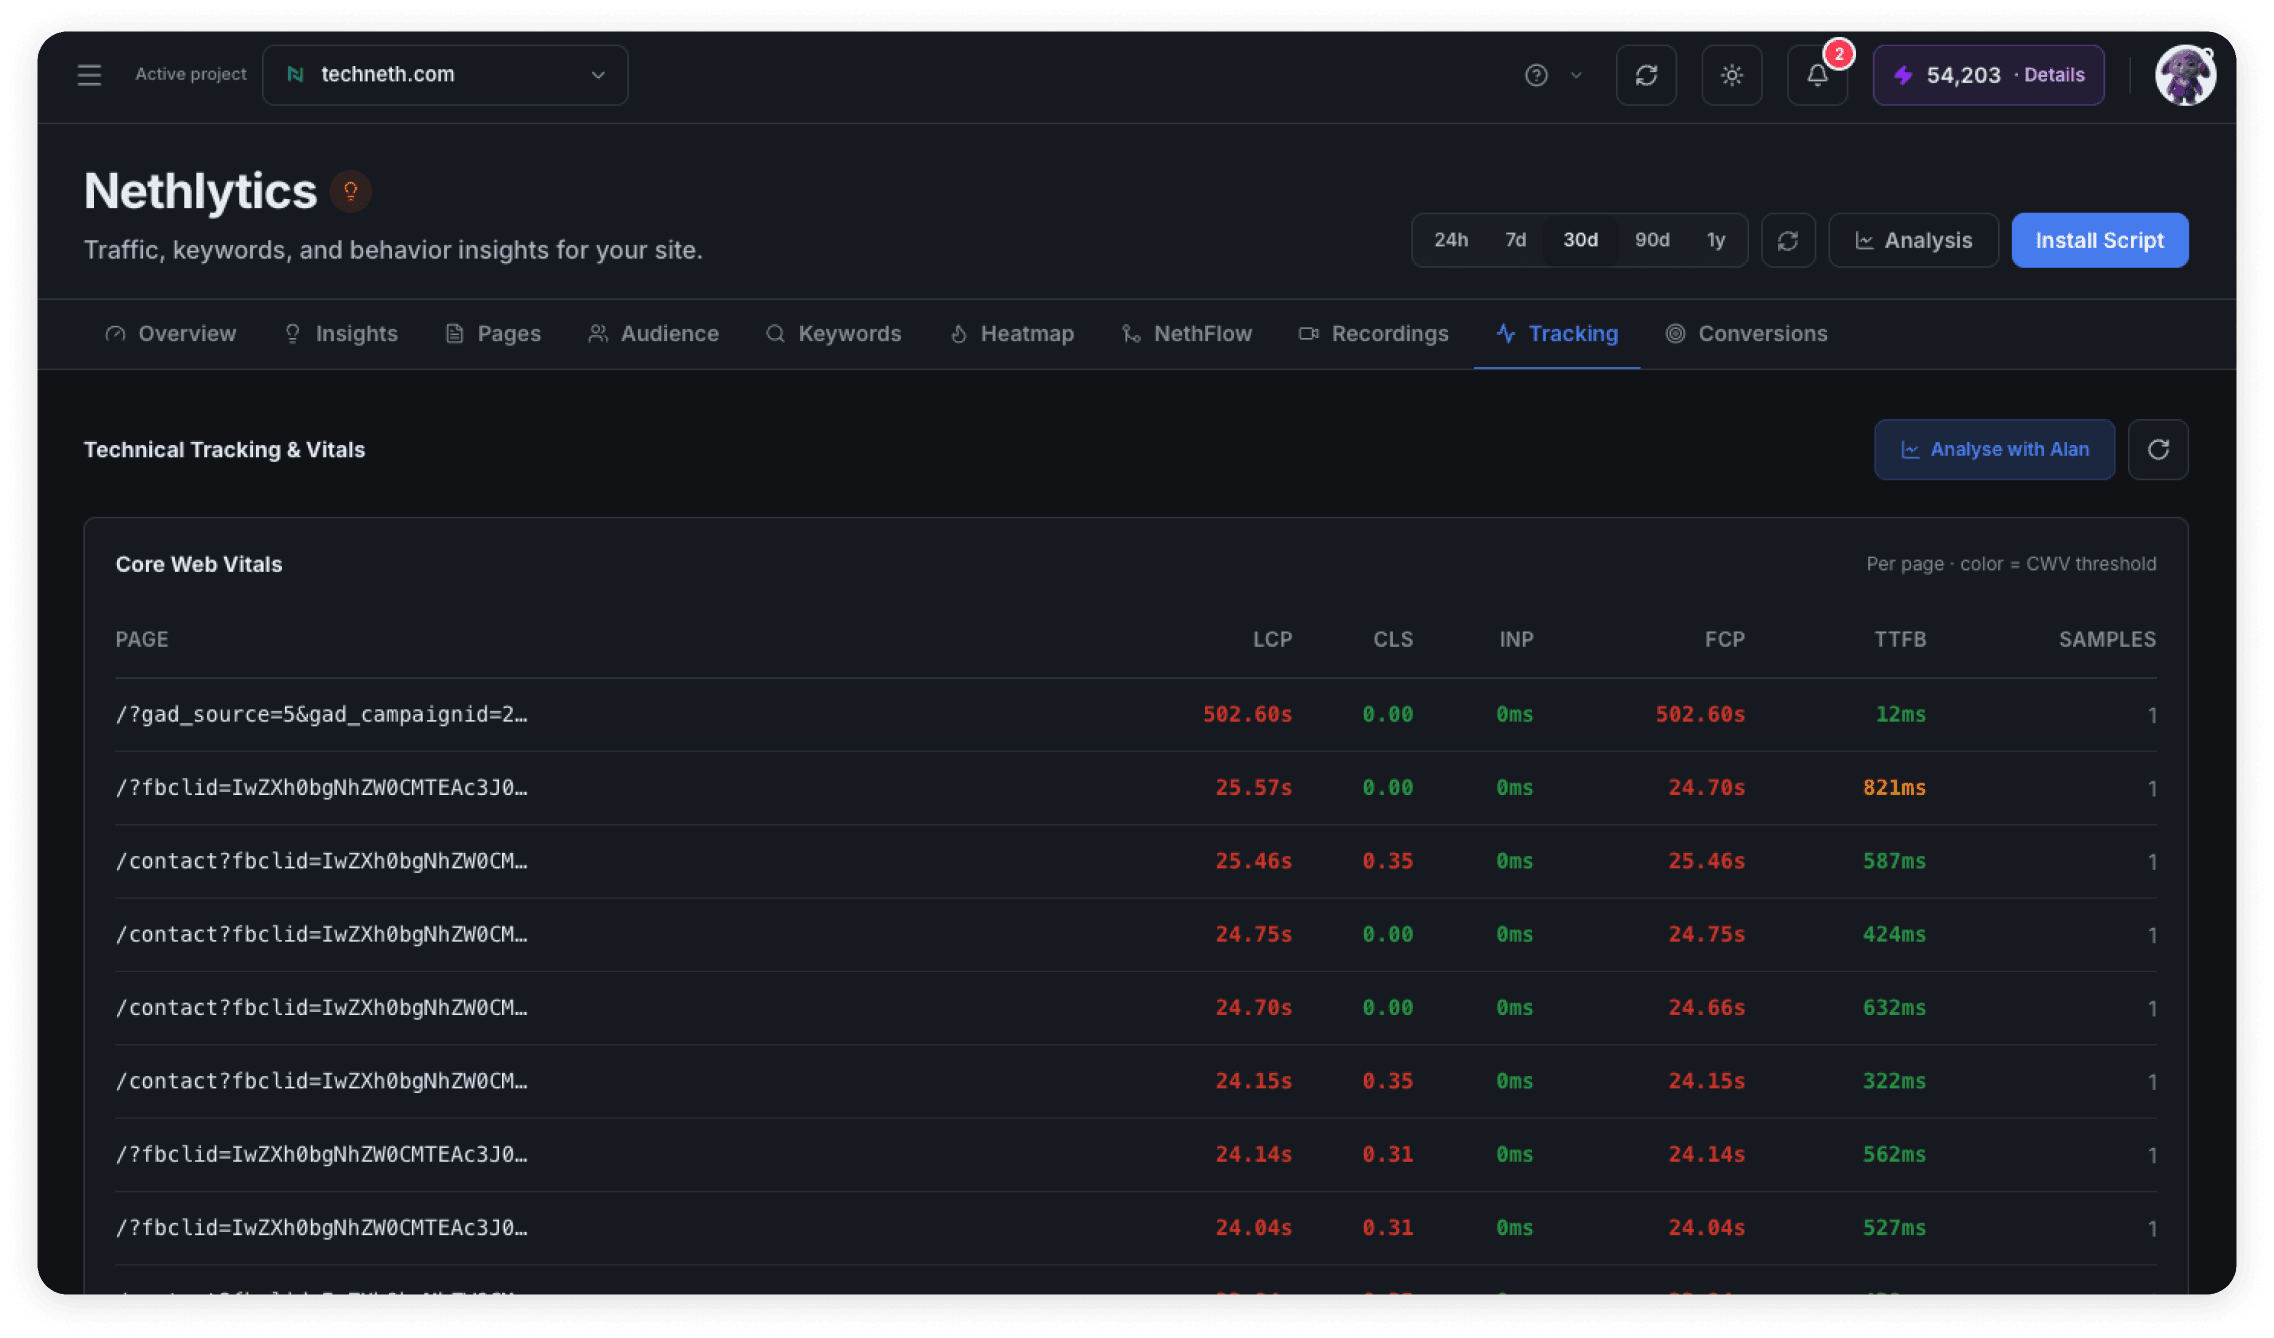
Lead scores and churn risk delivered with the factors that drove each score, so a sales or success team can act rather than guess. Scores are written back into the CRM the team already works in, on a schedule that matches how they work.
- Lead scoring and churn risk with per record explanations
- Written back into your CRM or product, not a separate tool
- Drift monitoring, with retraining when accuracy slips
The real impact
Why it matters
Most teams already know what happened and find out too late to change it. Moving from reporting to forecasting buys that time back, but only when the output is accurate enough to trust and explainable enough that somebody is willing to act on it.
The market for predictive analytics is growing rapidly as businesses shift from descriptive to forward-looking analytics. Organisations that delay building predictive capabilities are falling behind competitors who act on forecasts, not reports.
Source: Crunchbase / Market Research, 2025
Predictive analytics can cut operational costs by 20 to 40% while improving business outcomes by 20 to 33%. The savings come from better demand planning, reduced waste, proactive maintenance, and targeted retention.
Source: SQ Magazine / Data Analytics Statistics, 2026
Nearly half of businesses have already adopted machine learning for demand planning. The remaining 55% are making decisions with less accurate methods. The adoption curve is accelerating.
Source: Gartner Survey
Technologies we build with
 BigQuery
 Snowflake
 PostgreSQL
 Power BIBigQuerySnowflakePostgreSQLPower BI
 Kafka
Kafka Python
 React
React D3.jsKafkaPythonReactD3.js
Explore more
Related services
More ways we help teams with data and analytics.
FAQ
Frequently asked questions
Everything you need to know about this service.
It depends on the question. Forecasting usually needs two to three years of history to capture seasonality. Churn or scoring models need enough past examples of the outcome, often a few thousand records. The feasibility stage gives you a direct answer before you commit.
Ready to start your next project?
Let us turn your idea into software that scales. Book a free consultation and we will map out the build with you.
Trusted by the teams we build with