Custom Dashboards Built Around Real Decisions
Dashboards designed around the decisions your team actually makes, with live data, alerts when something moves, and role based access so everyone sees their own numbers and nothing else.
Overview
What is Custom Dashboard Development?
A custom dashboard is a screen built for one organisation and its own data and decisions, rather than a generic template. It connects directly to the systems holding the data, presents the metrics that matter to a specific audience, and can update in real time with alerts on thresholds.
A dashboard is not a wall of charts, it is an answer to a question somebody asks regularly. So the work starts by identifying those questions and who asks them, then designing one screen per audience rather than one screen for everybody. Underneath, data is connected and modelled, refresh is automated, and thresholds trigger alerts so people learn about a problem without having to check. Access is role based, and the whole thing is built to load quickly on the device it will actually be read on.
Capabilities and features
One Screen per Audience, Not One for Everyone
A finance lead, an operations manager, and a founder want different things from the same data. Each view is designed around the questions that audience asks and the actions they can take, which is why they still get opened in month three.
- Questions and decisions mapped per role before design starts
- Separate views instead of one dashboard nobody owns
- Only metrics that lead to a decision make the screen
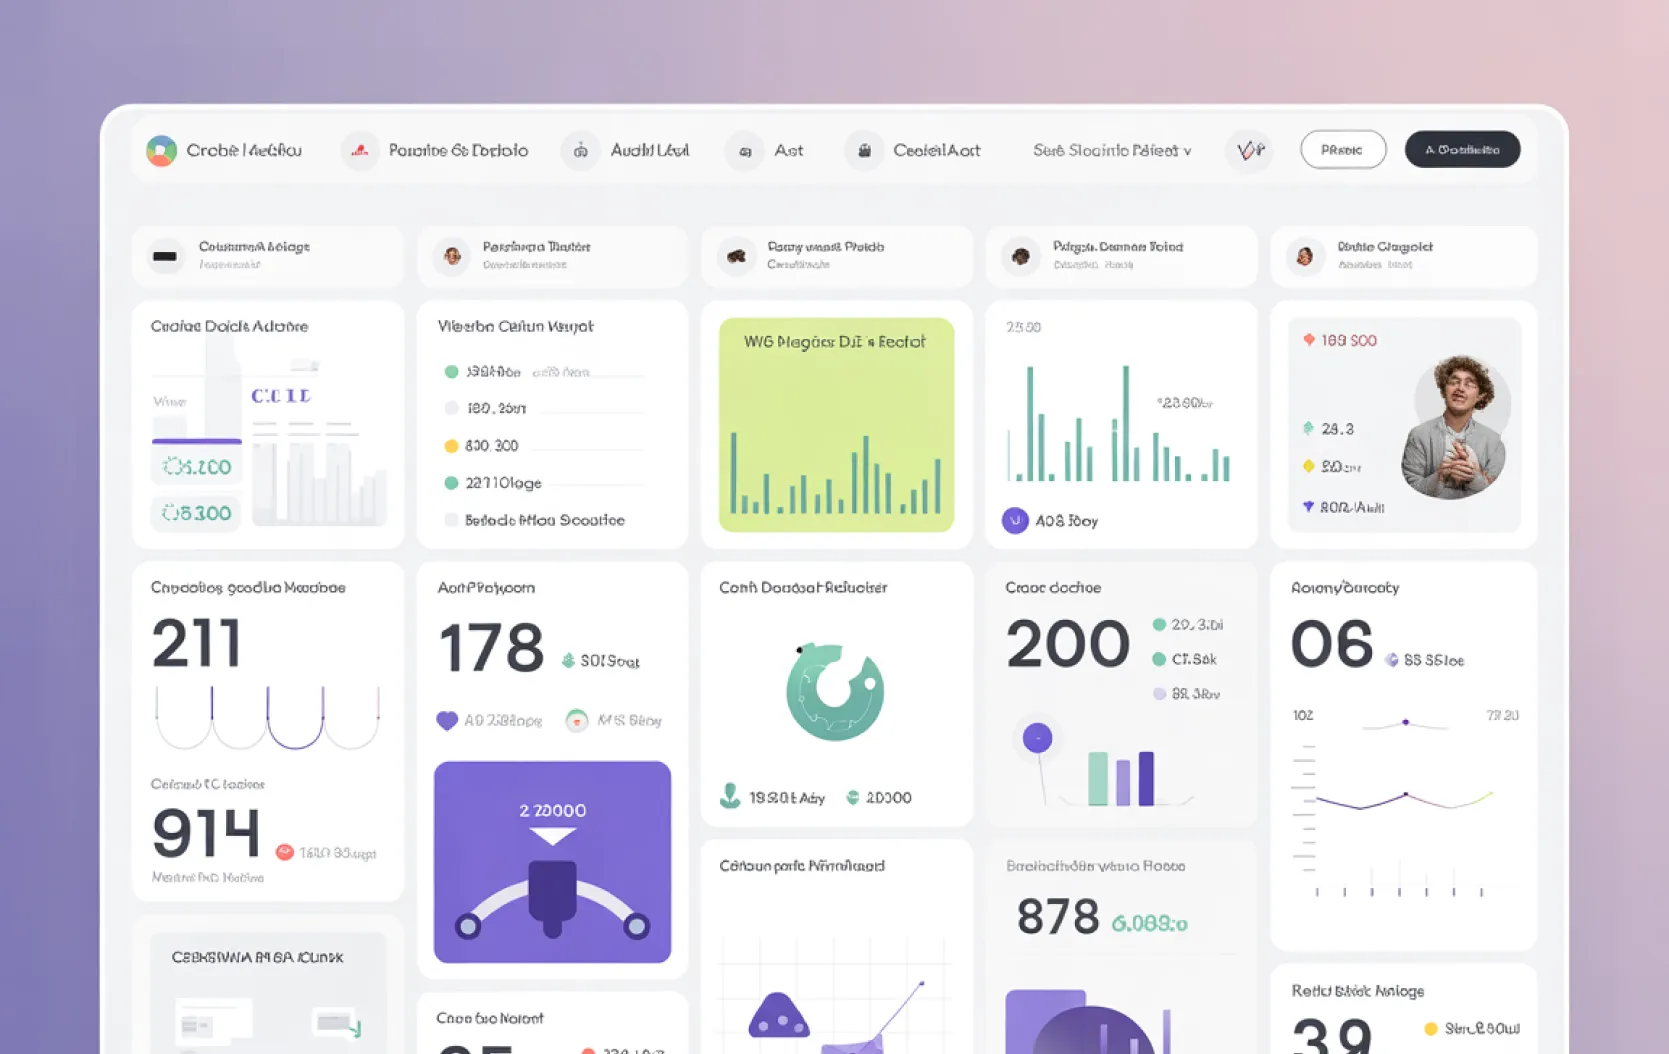
Readable at a Glance, Deep on Demand
Chart types are chosen for the comparison being made rather than for variety, and the layout follows how people scan. Detail sits one click away instead of crowding the top level, and everything stays legible on the phone where most people check it.
- Chart types matched to the comparison, with clear labels
- Drill down and filters for detail without leaving the page
- Readable on desktop, tablet, and phone
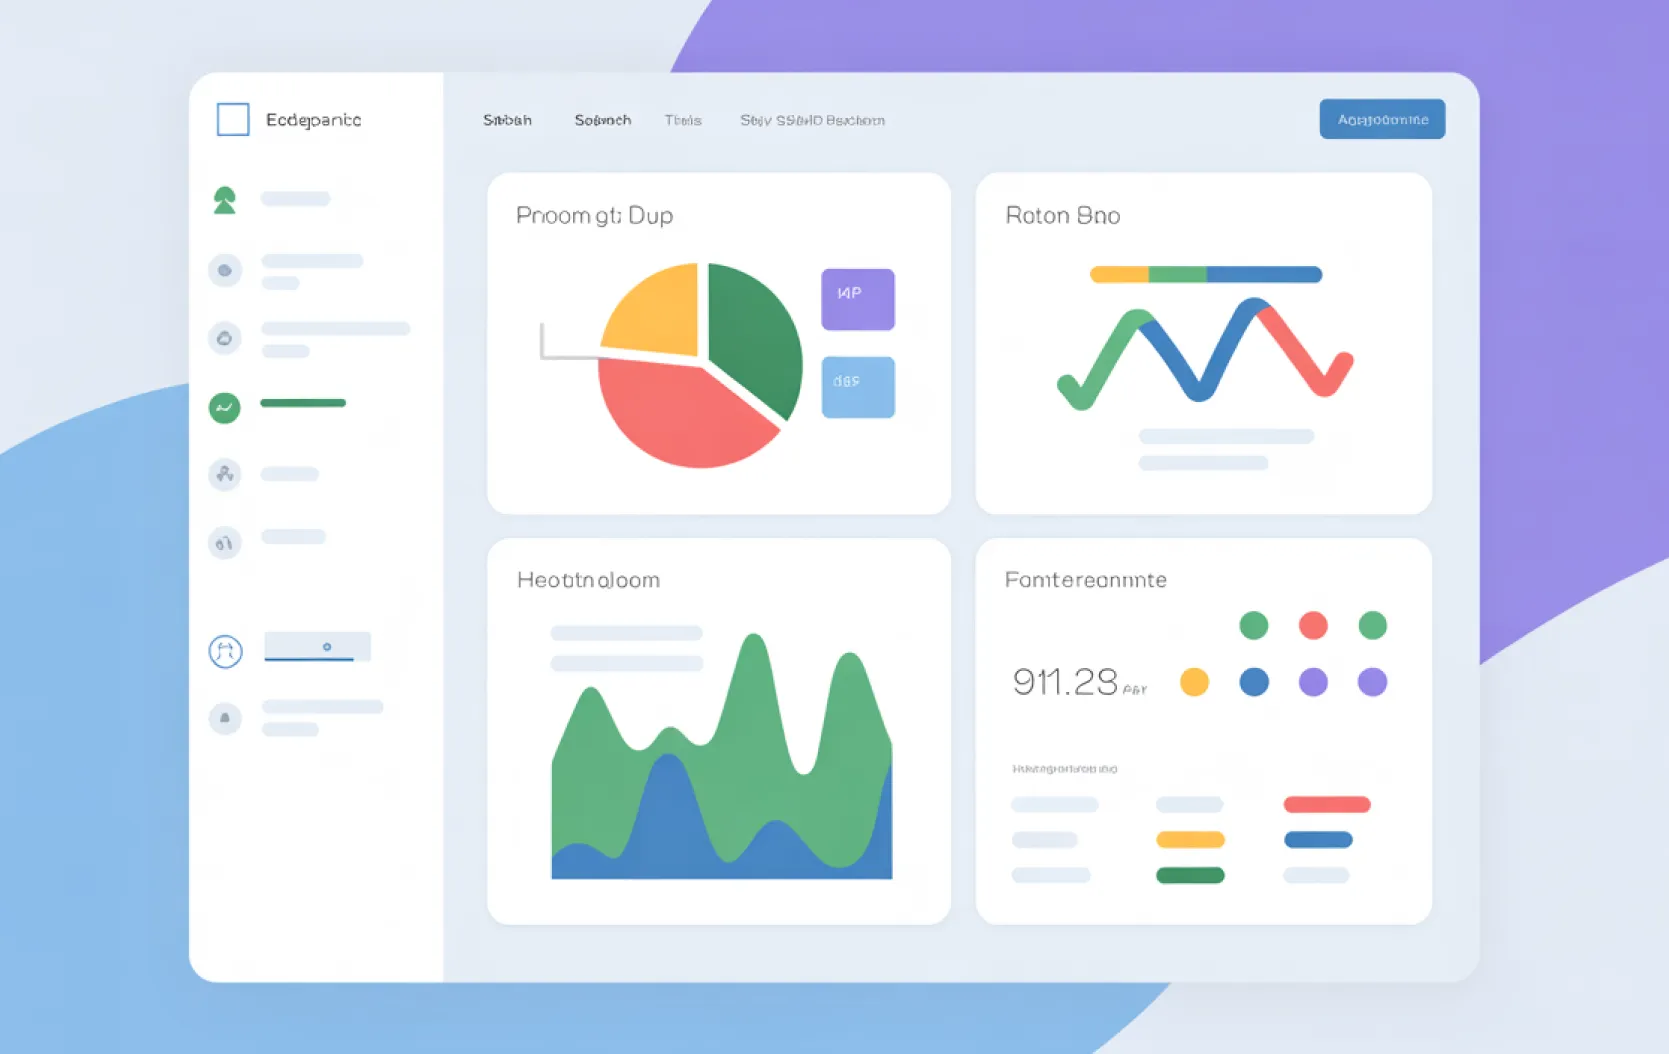
You Get Told, You Do Not Have to Look
Connections to your databases, CRM, finance system, and third party APIs, with refresh matched to how fast each source actually changes. Thresholds and anomalies trigger email, Slack, or webhook alerts, so the dashboard works when nobody is watching it.
- Live or scheduled refresh matched to each source
- Threshold and anomaly alerts by email, Slack, or webhook
- Role based access, audit trail, and export controls
The real impact
Why it matters
Off the shelf dashboards show what the tool can measure, not what you need to decide. So people export to a spreadsheet, and the spreadsheet quietly becomes the real system. A dashboard built around the decision removes that step and the delay attached to it.
The BI dashboard market is valued at $4.8 billion in 2024 and growing at 11.2% annually. Custom dashboards are not a luxury. They are becoming baseline infrastructure for data-driven businesses.3
Source: Verified Market Reports, 2025
BI implementations deliver an average 127% return on investment within three years. A well-built dashboard pays for itself through faster decisions, reduced manual reporting, and fewer costly mistakes.
Source: DataStackHub / BI Statistics, 2025
Up from 48% in 2023. Decision-makers increasingly expect real-time access to performance data, not monthly PDF reports. If your leadership team does not have a dashboard, they are behind the curve.
Source: DataStackHub / BI Statistics, 2025
Technologies we build with
 BigQuery
 Snowflake
 PostgreSQL
 Power BIBigQuerySnowflakePostgreSQLPower BI
 Kafka
Kafka Python
 React
React D3.jsKafkaPythonReactD3.js
Explore more
Related services
More ways we help teams with data and analytics.
FAQ
Frequently asked questions
Everything you need to know about this service.
Use a BI tool when standard charts on standard sources answer your questions, because it is cheaper. Build custom when the metrics involve your own business logic, when the data lives in several places, or when you need it embedded in a product your customers use.
Ready to start your next project?
Let us turn your idea into software that scales. Book a free consultation and we will map out the build with you.
Trusted by the teams we build with